Travel to school survey on Thu 20th Mar 2025
19 pupils and staff included in this survey generated 3.62kg carbon by travelling to school
That's the same as charging 2452 smart phones 📱!
- 47% walked or cycled, generating zero CO2
- 37% travelled by car
- 0% travelled by public transport
- 16% used park and stride
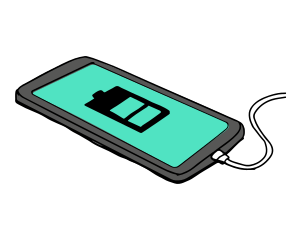
19 pupils and staff included in this survey generated 3.62kg carbon by travelling to school
That's the same as playing 88 hours of computer games 🎮!
- 47% walked or cycled, generating zero CO2
- 37% travelled by car
- 0% travelled by public transport
- 16% used park and stride

19 pupils and staff included in this survey generated 3.62kg carbon by travelling to school
That's the same as 441 hours of TV 📺!
- 47% walked or cycled, generating zero CO2
- 37% travelled by car
- 0% travelled by public transport
- 16% used park and stride

19 pupils and staff included in this survey generated 3.62kg carbon by travelling to school
That's the same as 7 veggie dinners 🥗!
- 47% walked or cycled, generating zero CO2
- 37% travelled by car
- 0% travelled by public transport
- 16% used park and stride

19 pupils and staff included in this survey generated 3.62kg carbon by travelling to school
That's the same as 4 meat dinners 🍲!
- 47% walked or cycled, generating zero CO2
- 37% travelled by car
- 0% travelled by public transport
- 16% used park and stride

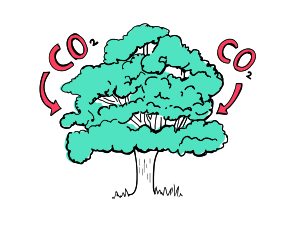
19 pupils and staff included in this survey generated 3.62kg carbon by travelling to school
1 tree would absorb this amount of CO2 in 2 days 🌳!
- 47% walked or cycled, generating zero CO2
- 37% travelled by car
- 0% travelled by public transport
- 16% used park and stride
Let's look at this in more detail:
Breakdown of journeys by transport category
| Transport category | Total pupils & staff | Percentage pupils & staff |
|---|---|---|
| Walking and cycling | 9 | 47% |
| Car | 7 | 37% |
| Public transport | 0 | 0% |
| Park and stride | 3 | 16% |
| Other | 0 | 0% |
Breakdown of journeys by car
Persuading people who travel only 5 minutes by car to switch to coming to school by foot or bike is a great first step to reducing the school's carbon footprint from travel.
| Time travelled by car | Total pupils & staff |
|---|---|
| 5 minutes | 3 |
| 10 minutes | 4 |
| 15 minutes | 0 |
| 20 minutes | 0 |
| 30 or more minutes | 0 |